Visualizations
In your browser, navigate back to the Kibana console
You are going to ensure there is data in the domain. Navigate to the “Discover” plugin. The plugin will ask you to create an index pattern.
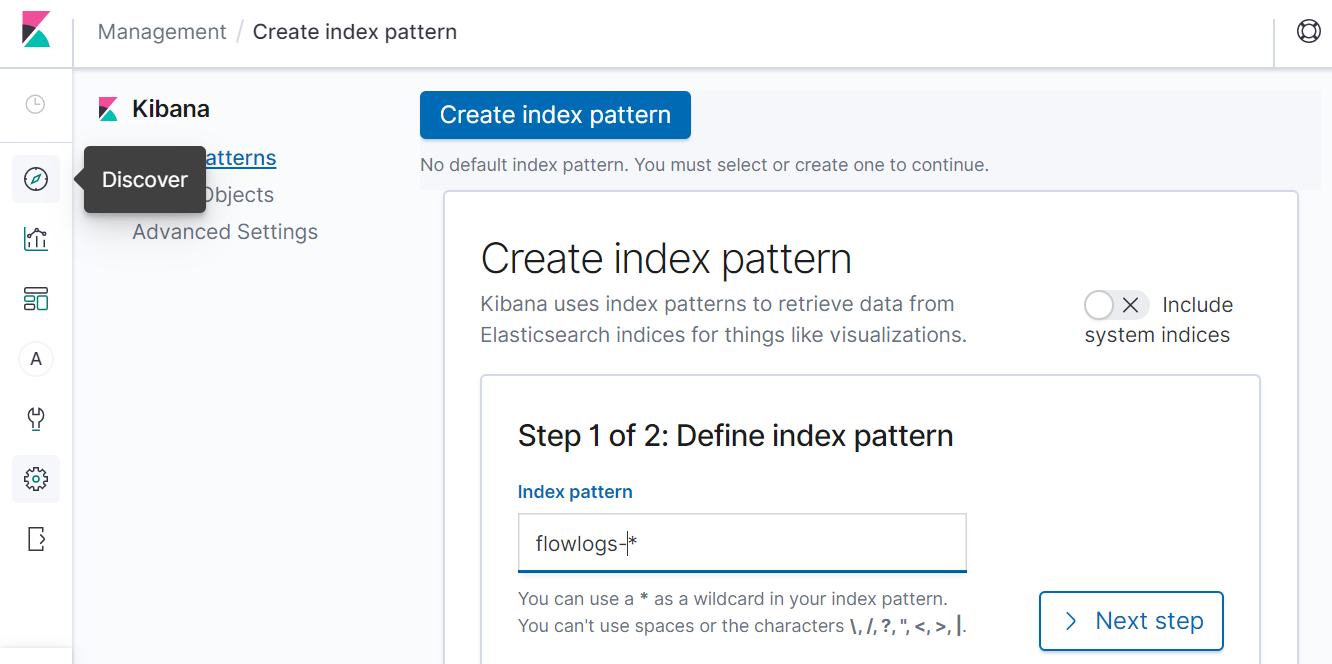
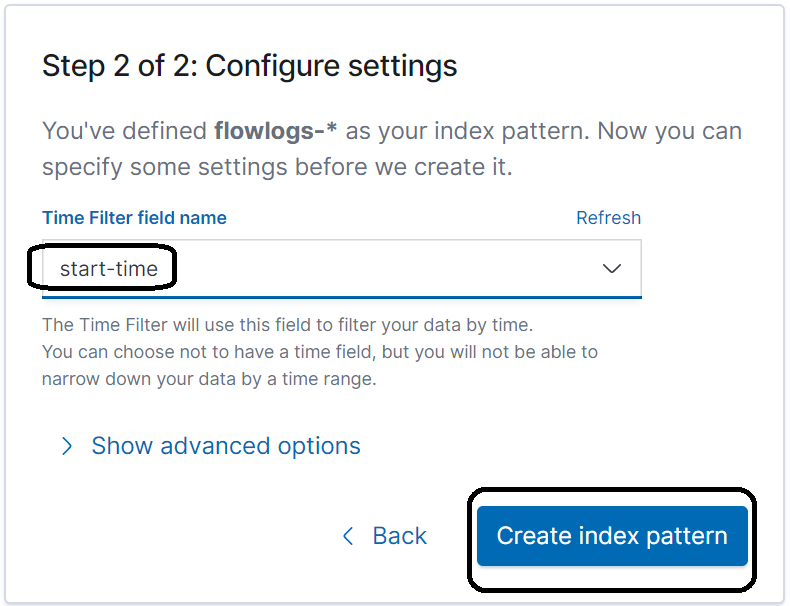
Type in flowlogs-* and click on Next step.
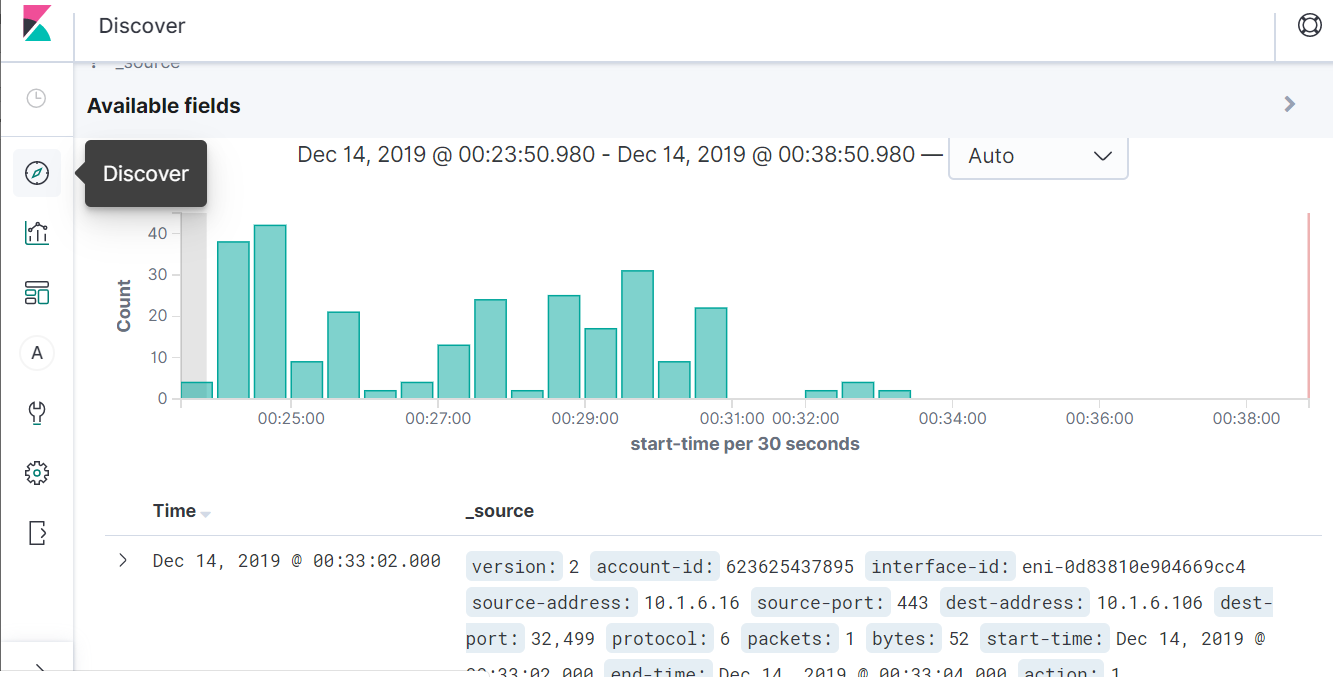
Now you can explore the data in the Discover plugin and this verifies that you are receiving data from Lambda.
Create visualizations and a dashboard
For this lab, you are going to use the Import feature that gives you a way in which already prepared visualizations and dashboards are brought in to Kibana.
First, download the visualizations and dashboard by clicking on the following link and save the file locally.
https://search-sa-log-solutions.s3-us-east-2.amazonaws.com/flowlogs/config/dashies_and_vizziz.json
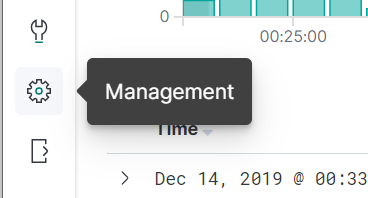
Now, navigate to the Management plugin.
Import the dashboard and visualizations
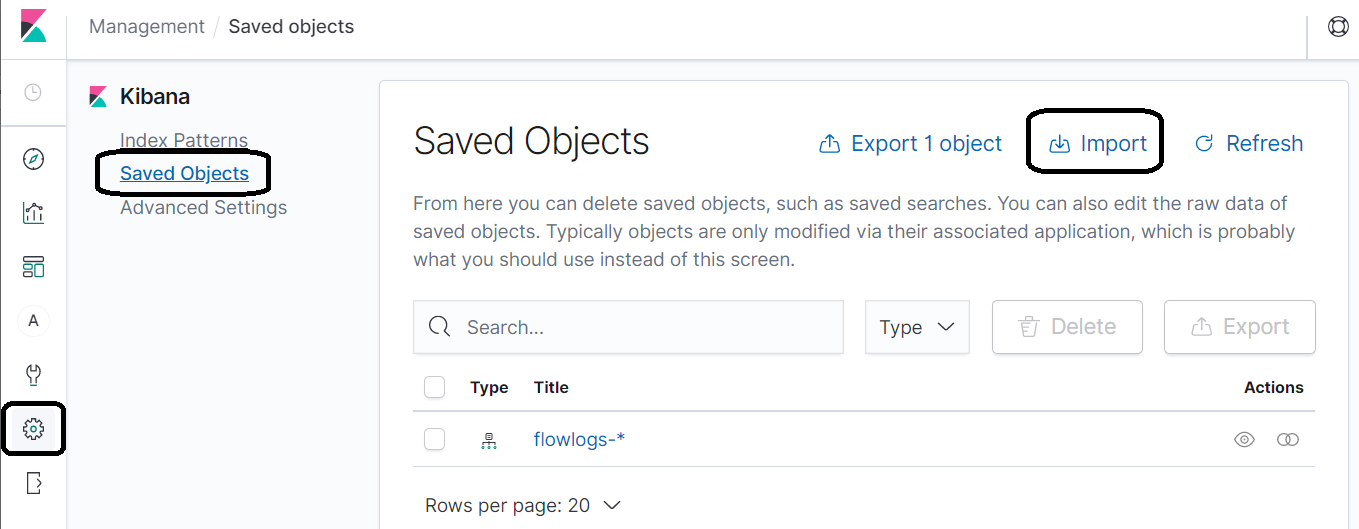
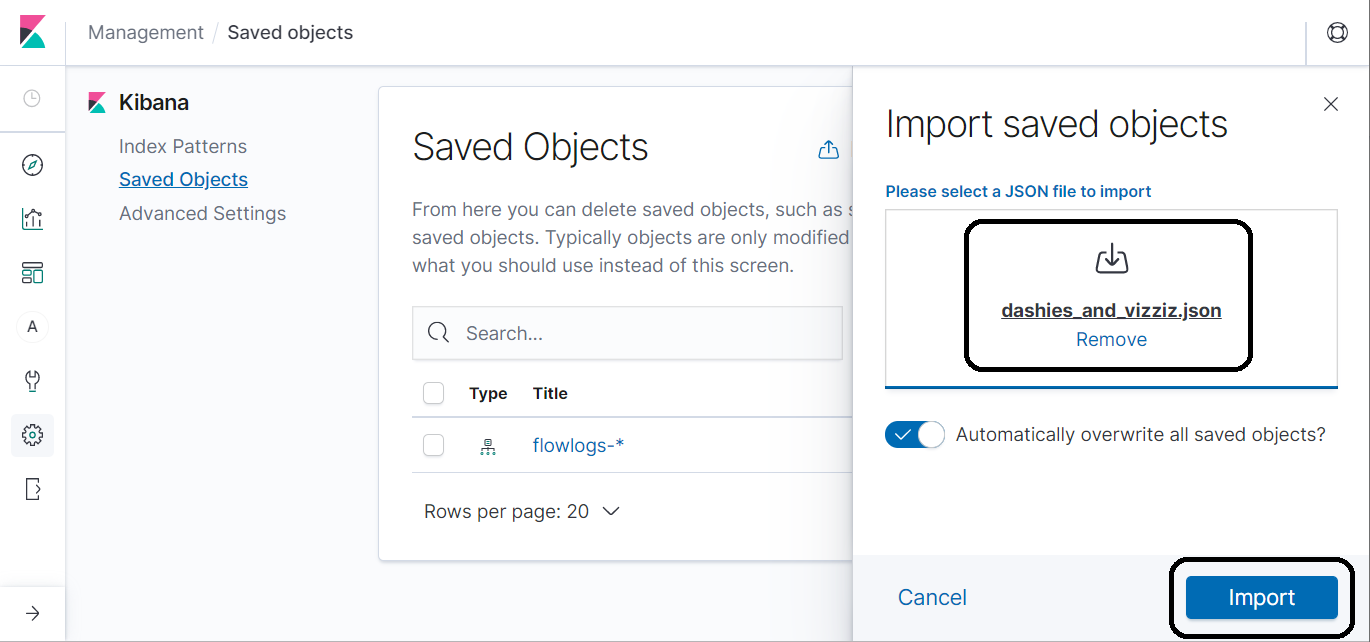
Under Saved Objects, click on the Import breadcrumb and upload the file you just downloaded.
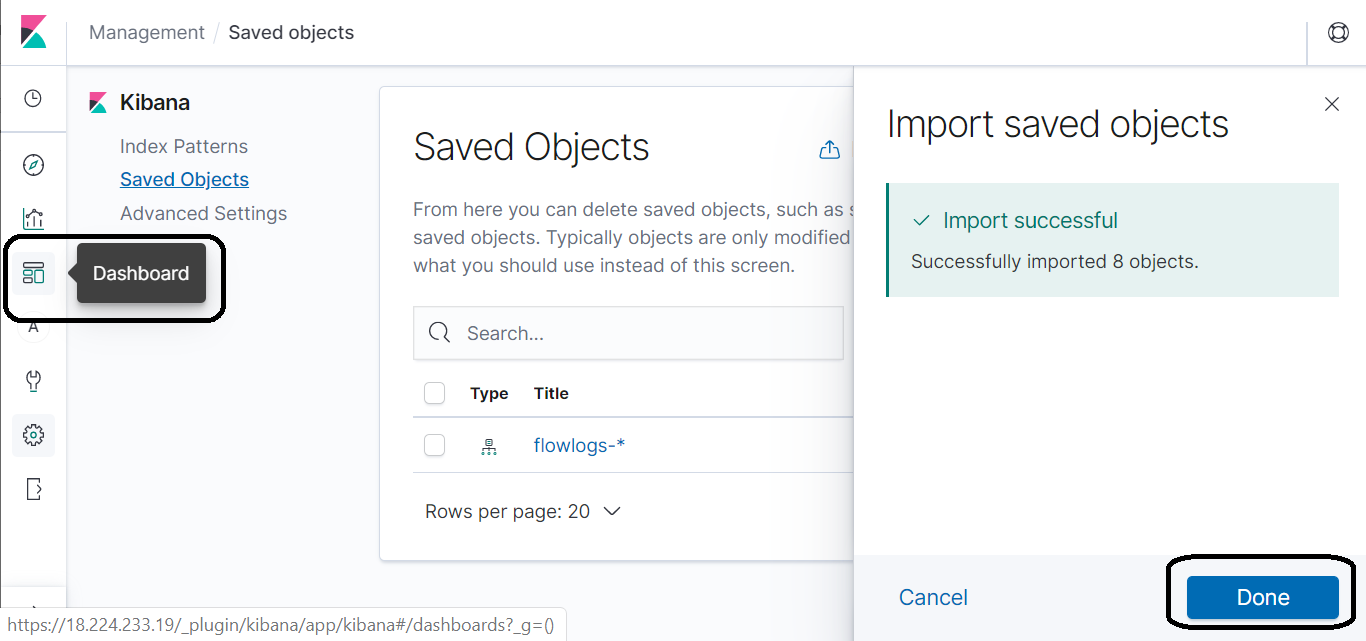
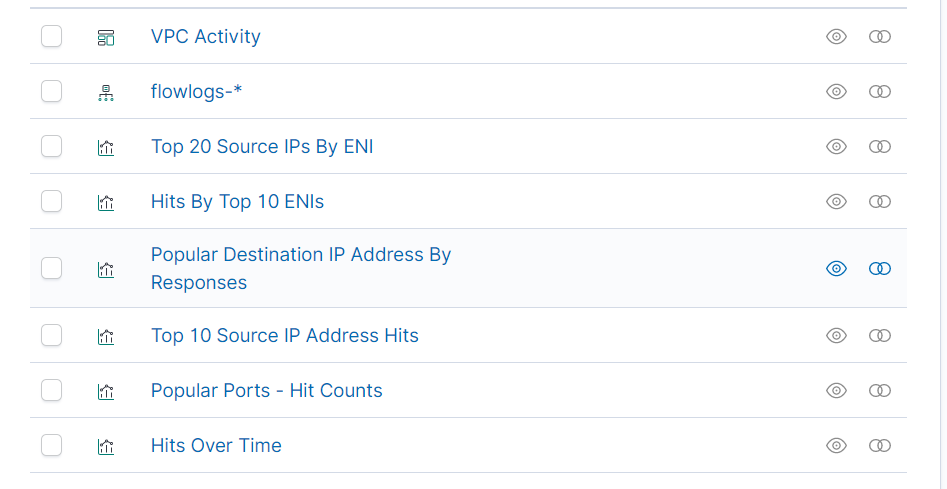
Once the dashboard and visualizations import, you can navigate to the Dashboard plugin after clicking on Done. Before you navigate to the Dashboard plugin, review the imports.
Render the dashboard
In the Dashboards pane, click on the VPC Activity dashboard.
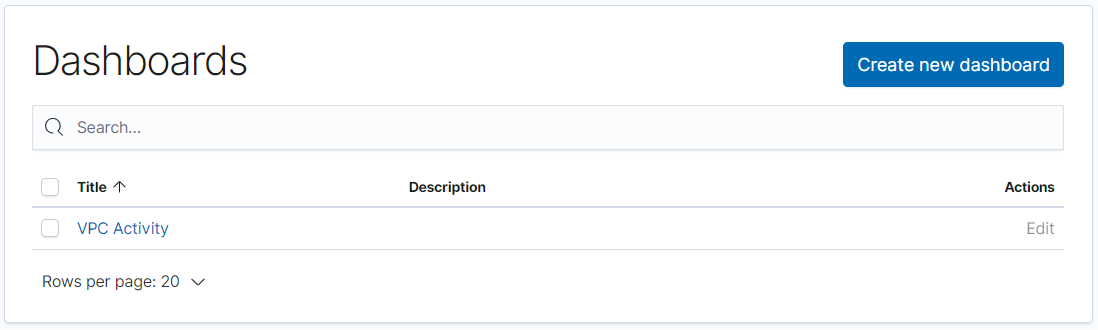
Review the dashboard.
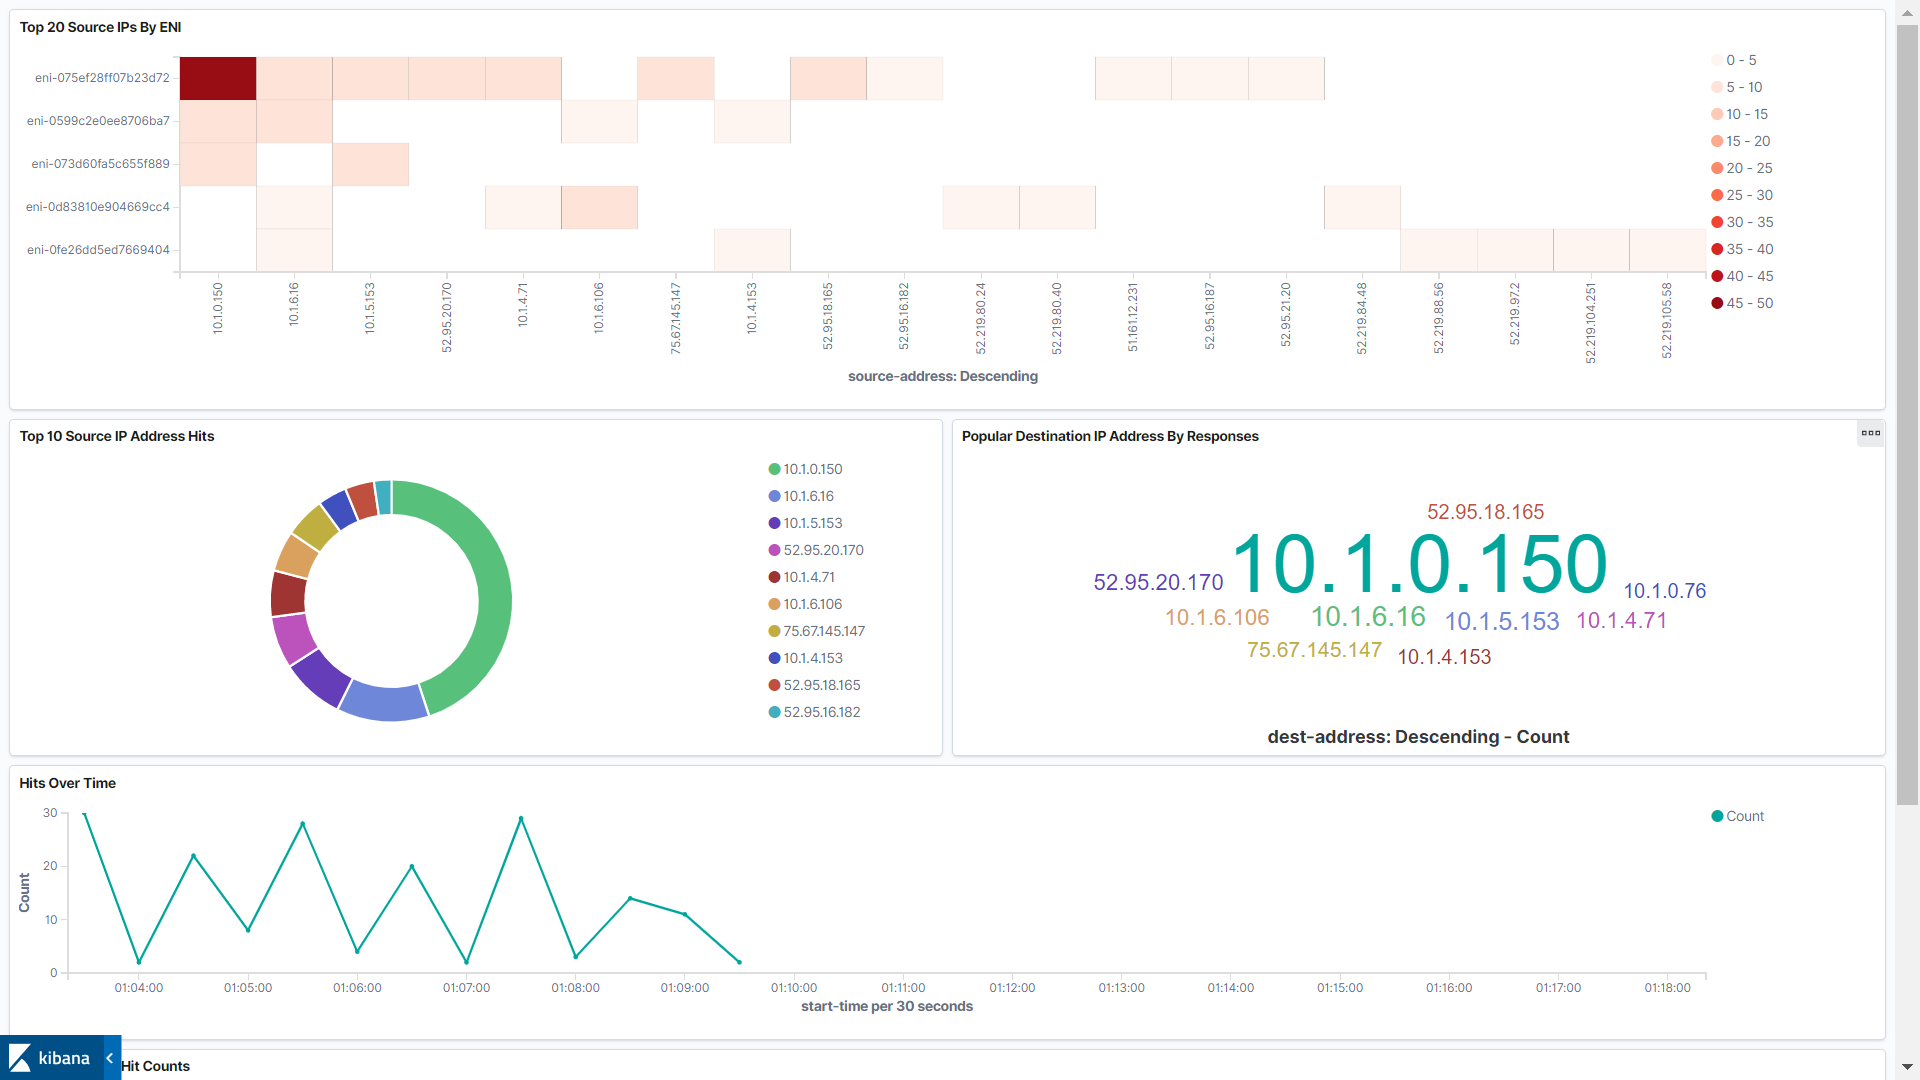
Success! You have captured VPC Flow Logs and turned the data into a visual representation of the activity in your VPC.