Proxy Server
Configure the proxy server
In this step, you will start NGINX. The instance has the configurations necessary to make the proxy work. Let us review what the config looks like, as these are custom wired for your domain access. Navigate to the management console for the AWS Systems Manager and highlight the “*-kibana-proxy” instance.
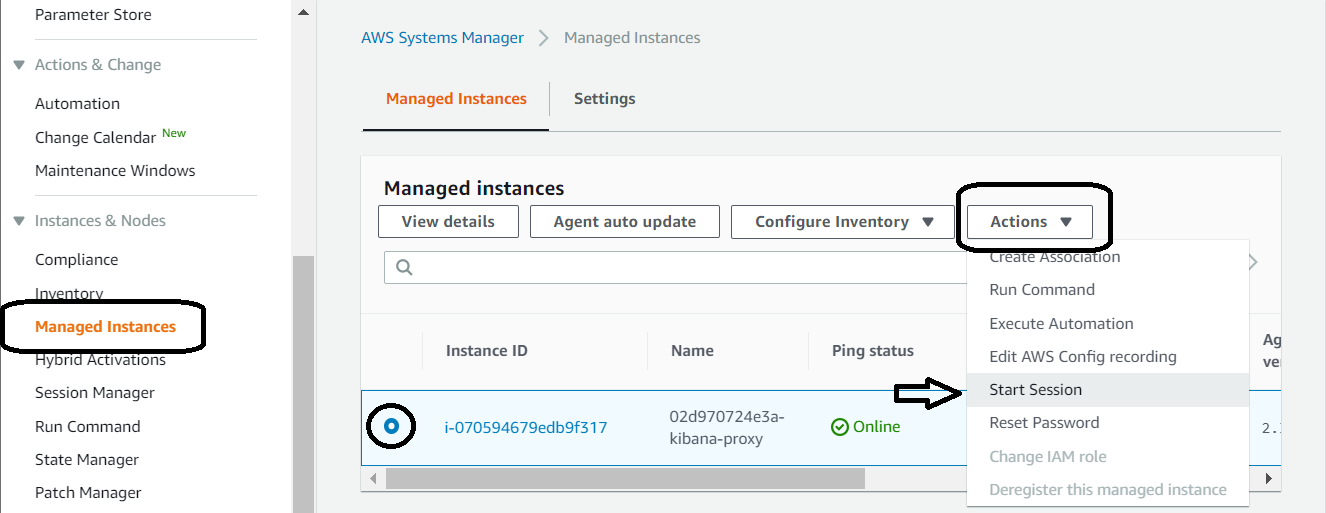
Observe you have a window similar to mine.
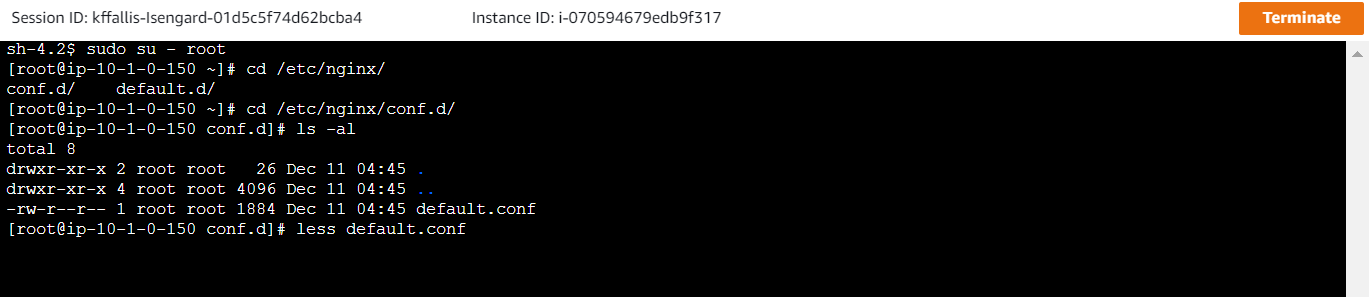
Type in the following commands:
sh-4.2 # sudo su - root
[root@ip-10-1-0-150 ~]# cd /etc/nginx/conf.d/
[root@ip-10-1-0-150 conf.d]# ls -al
total 8
drwxr-xr-x 2 root root 26 Dec 11 04:45 .
drwxr-xr-x 4 root root 4096 Dec 11 04:45 ..
-rw-r--r-- 1 root root 1884 Dec 11 04:45 default.conf
[root@ip-10-1-0-150 conf.d]# less default.conf
You will see a configuration similar to the one below. Note that calls to Amazon Cognito (specifically your Cognito domain) and the Amazon Elasticsearch Service allow you to use the proxy server to negotiate authentication through the proxy server. Since your Amazon Cognito domain name is publically accessible, you need something to broker the calls between the private IP addresses for the ENIs on the Amazon Elasticsearch domain to actually talk to the Amazon Cognito service. Additionally, the proxy server exposes the Kibana endpoint to authenticated public access. For more details, read this document.
server {
    listen 443;
    server_name $host;
    rewrite ^/$ https://$host/_plugin/kibana redirect;

    ssl_certificate           /etc/nginx/cert.crt;
    ssl_certificate_key       /etc/nginx/cert.key;

    ssl on;
    ssl_session_cache  builtin:1000  shared:SSL:10m;
    ssl_protocols  TLSv1 TLSv1.1 TLSv1.2;
    ssl_ciphers HIGH:!aNULL:!eNULL:!EXPORT:!CAMELLIA:!DES:!MD5:!PSK:!RC4;
    ssl_prefer_server_ciphers on;

    location ^~ /_plugin/kibana {
        # Forward requests to Kibana
        proxy_pass https://vpc-flow-lab-02d970724e3a-ddajvbu535jlxlwkqf4cfp7qva.us-east-2.es.amazonaws.com/_plugin/kibana;

        # Handle redirects to Amazon Cognito
        proxy_redirect https://domain-02d970724e3a.auth.us-east-2.amazoncognito.com https://$host;

        # Update cookie domain and path
        proxy_cookie_domain vpc-flow-lab-02d970724e3a-ddajvbu535jlxlwkqf4cfp7qva.us-east-2.es.amazonaws.com $host;
        proxy_set_header Accept-Encoding "";
        sub_filter_types *;
        sub_filter vpc-flow-lab-02d970724e3a-ddajvbu535jlxlwkqf4cfp7qva.us-east-2.es.amazonaws.com $host;
        sub_filter_once off;

        # Response buffer settings
        proxy_buffer_size 128k;
        proxy_buffers 4 256k;
        proxy_busy_buffers_size 256k;
    }
    location ~ \/(log|sign|error|fav|forgot|change) {
        # Forward requests to Cognito
        proxy_pass https://domain-02d970724e3a.auth.us-east-2.amazoncognito.com ;

        # Handle redirects to Kibana
        proxy_redirect https://vpc-flow-lab-02d970724e3a-ddajvbu535jlxlwkqf4cfp7qva.us-east-2.es.amazonaws.com https://$host;

        # Handle redirects to Amazon Cognito
        proxy_redirect https://domain-02d970724e3a.auth.us-east-2.amazoncognito.com  https://$host;

        # Update cookie domain
        proxy_cookie_domain domain-02d970724e3a.auth.us-east-2.amazoncognito.com  $host;
    }
}
After reviewing the config, start NGINX by using the following command:
[root@ip-10-1-0-150 conf.d]# service nginx start
Redirecting to /bin/systemctl start nginx.service
[root@ip-10-1-0-150 conf.d]#
Sign in to your Amazon Elasticsearch Kibana endpoint
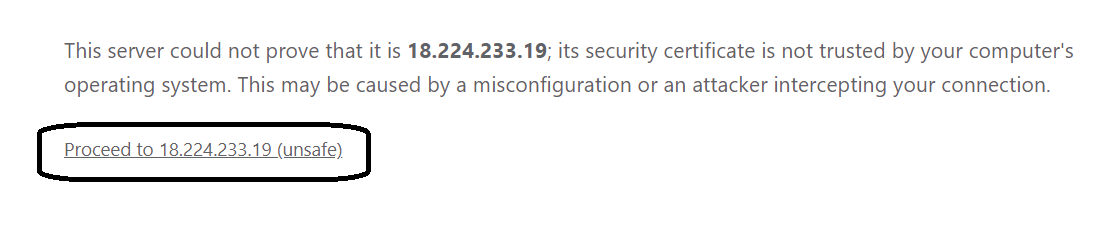
Using the URL for your NGINX server Kibana access, observe you have a login screen similar to the one shown here.
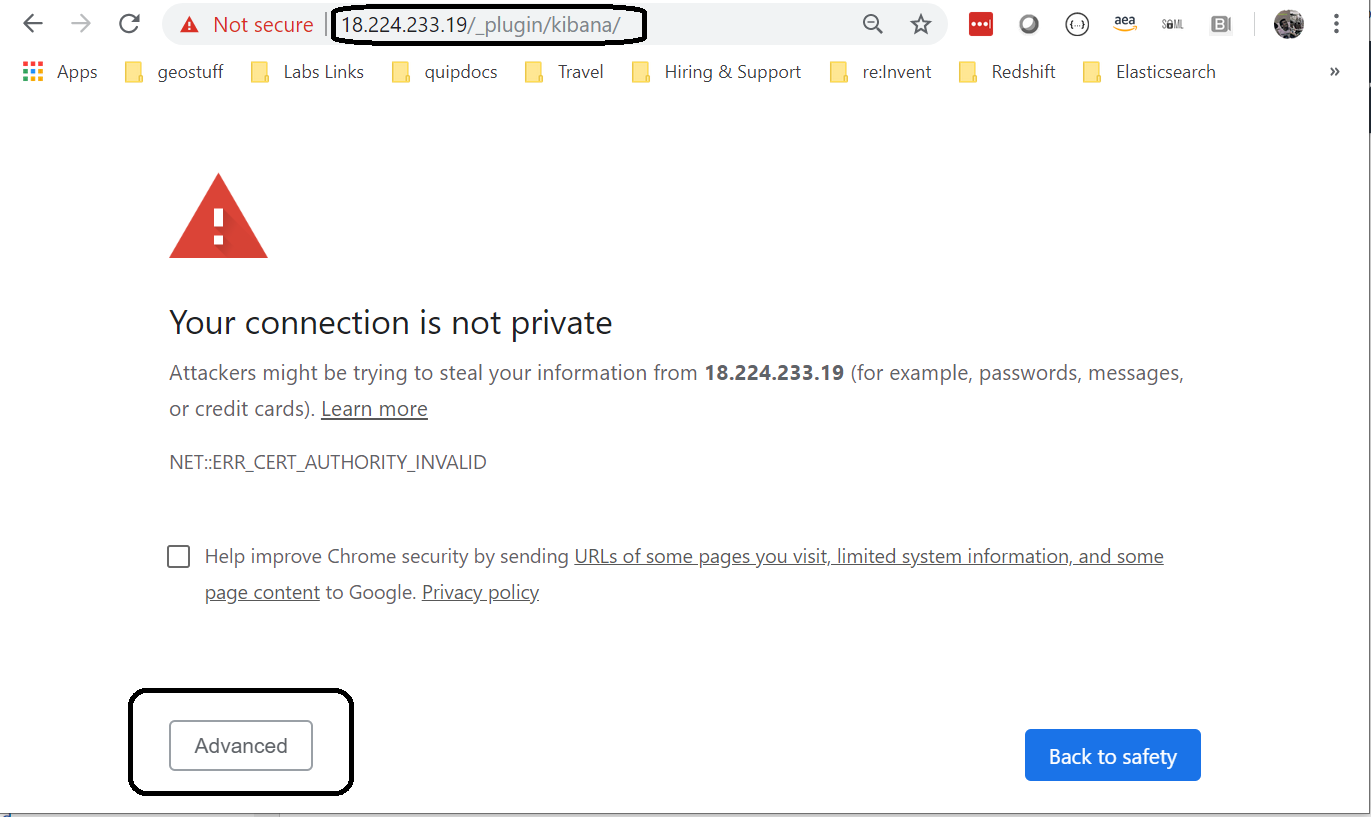
Click on advanced. Since you are using self-signed certificates, the “authority” that is responsible for public validation cannot be verified. That is ok, click “advanced”, and the following screen will appear. Navigate using that breadcrumb.
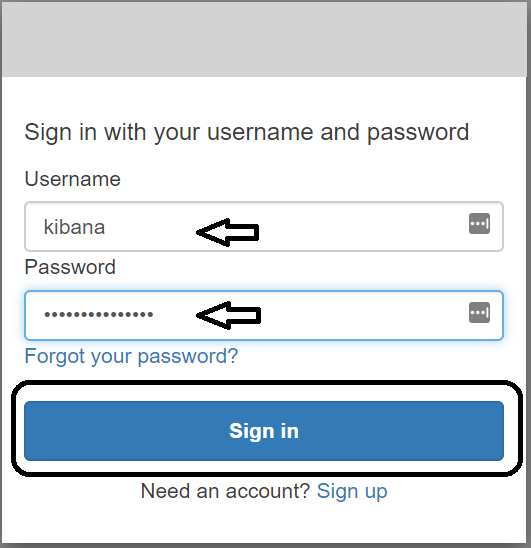
You will see a login screen. Using the credentials found in the output for the stack creation in AWS CloudFormation, enter them in and Sign in.
You will need to change your password.
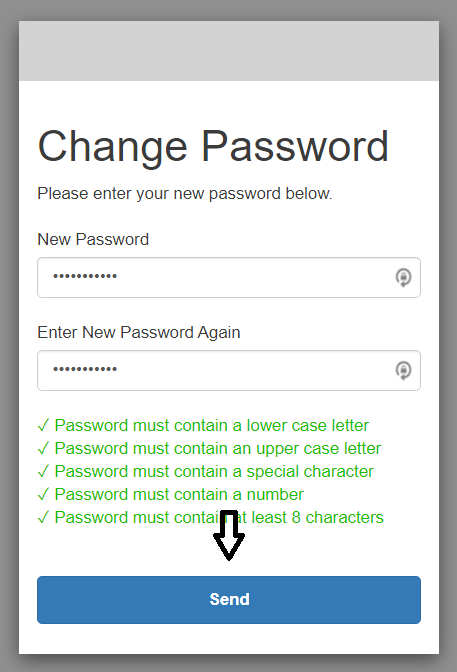
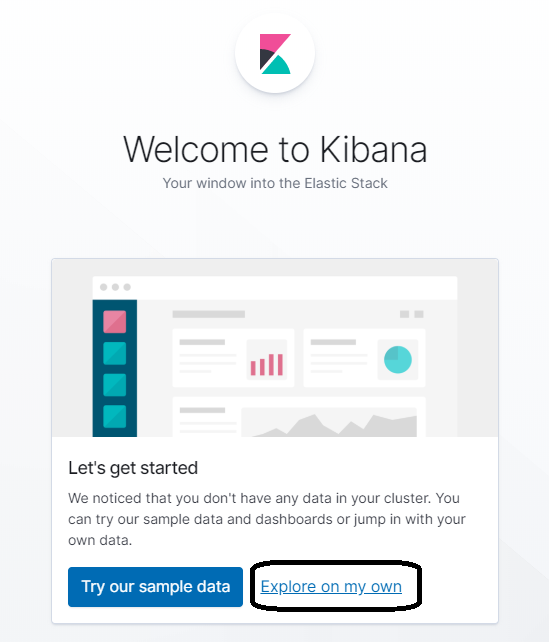
Once you accomplish that task, you will see the Kibana dashboard. Click on “Explore on my own”.